Price Efficiency on Uniswap
Constant product formula vs. order book.
In the previous post, we discussed the way by which an automated market maker (AMM) such as Uniswap determines market price. As mentioned, the fundamental mechanism underlying the decentralized exchange is known as the constant product formula, which states that given a certain supply of asset X and Y in the liquidity pool, the product of their outstanding balances should be a constant. This differs drastically from how traditional electronic exchanges such as NYSE, NASDAQ or even Coinbase functions, where buyers and sellers place their bid/ask prices to form order books, from which assets are priced.
Obviously, the law of one price dictates that under certain conditions, the price of the same asset must be the same everywhere - otherwise, it creates actionable arbitrage opportunity across markets. In practice, however, many market imperfections, i.e., trade frictions, prevent the principle from holding true. For example, the feasibility of the arbitrage trade depends on how much each transaction costs, how long the settlement takes, how easy it is to move money around, etc. Nonetheless, arbitrageurs can still step in and take advantage of the difference if the spread is wide enough to remain positive on an after-cost basis.
So how do the two stack up against each other? Let’s take a look at where they’ve been over Uniswap V2’s one year history.
Data Feeds
For this exercise, cryptocurrency price histories are extracted via the Tiingo Crypto API, where a variety of tickers are being aggregated across multiple crypto exchanges. Meanwhile, the historical liquidity pool data on Uniswap are pulled from the Graph. For more information, see the appendix.
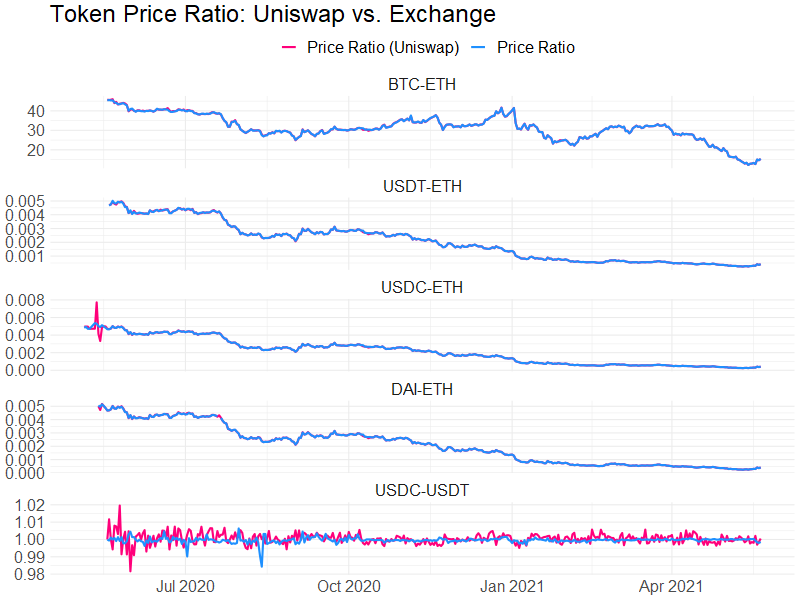
Price Discovery: Uniswap vs Exchange
By design of Uniswap, prices are always quoted in the context of an asset pair, e.g., BTC to ETH (such that USD has no special significance over the rest of the assets). To compare the price quotes between Uniswap and more “traditional” exchanges, we always price one asset in terms of another:
The divergence is more clearly visible on a price ratio spread % scale, using prices from exhcanges as the denominator:
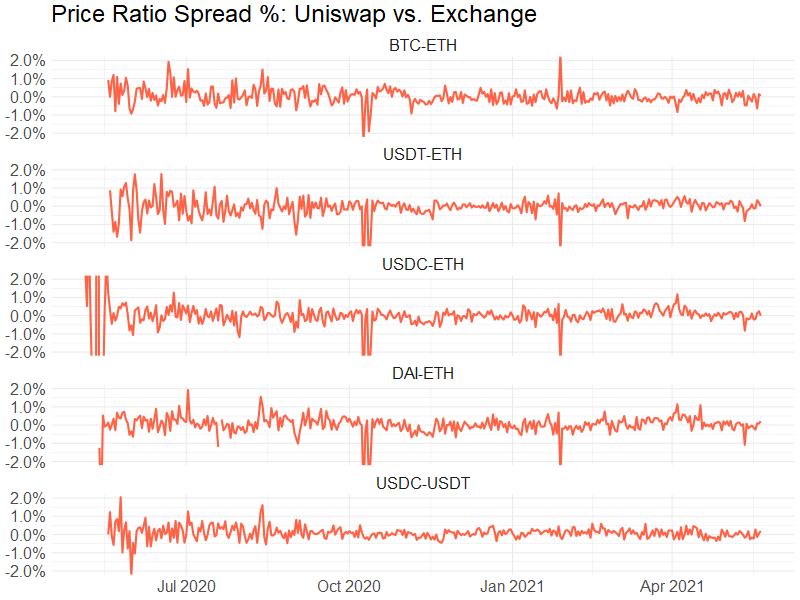
For most of the time, the price ratio on Uniswap is well within 1% of the “actual” value, i.e., the one quoted on order-book-style exchanges.
A Closer Look
Distribution-wise, each pair shows varying degree of deviation from a zero mean, though none is statistically significant. See the appendix for the details.
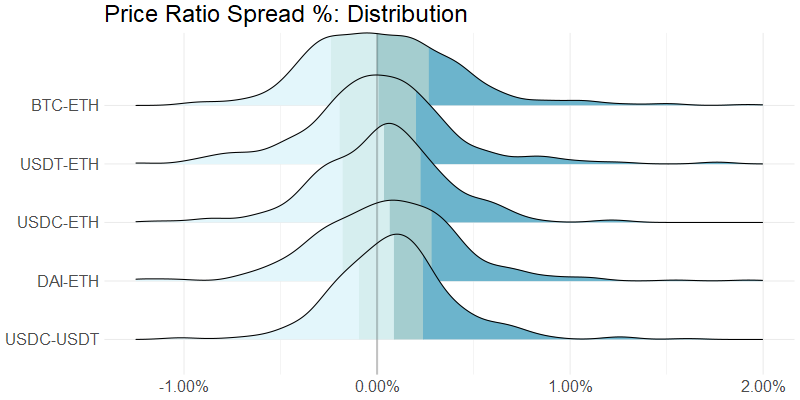
Notably, the USDC-USDT pair shows the biggest divergence. This could be partially explained by the fact the USDC-USDT pool is the worst funded one of all 5 liquidity pools above.
Conclusions
Uniswap is still a somewhat niche exchange - that is, even in the crypto space. On a relative basis, the “traditional” exchanges such as Binance and Coinbase offer greater liquidity (i.e., better market depth) than Uniswap does. To some extent, the price ratio spread is a reflection of the “additional” friction to trade on Uniswap today due to the limited liquidity it offers compared to Binance or Coinbase. It is by no means a deal-breaker though, as some would argue that the trade-off is worth it in light of the full on-chain transparency, the absence of a central counterparty, as well as the chance to win the UNI governance token.
Appendix
Summary Statistics
Price ratio difference %:
| pair | mean | sd | t |
|---|---|---|---|
| BTC-ETH | 0.04% | 0.0044 | 0.0800 |
| USDT-ETH | -0.04% | 0.0053 | -0.0805 |
| USDC-ETH | -0.02% | 0.0315 | -0.0080 |
| DAI-ETH | 0.02% | 0.0055 | 0.0321 |
| USDC-USDT | 0.09% | 0.0035 | 0.2467 |
Sample Query
The historical liquidity pool balances of the BTC/ETH pair on Uniswap (powered by the Graph):
{
  pairDayDatas(
    first: 1000,
    orderBy: date,
    orderDirection: desc,
    where: {
      pairAddress: "0xbb2b8038a1640196fbe3e38816f3e67cba72d940"
    }
  ){
    id
    date
    token0
    { id symbol }
    token1
    { id symbol }
    reserve0,
    reserve1,
    reserveUSD,
    dailyVolumeUSD
  }
}