Modern Portfolio Theory: A Case Study on Turnips
And how having friends makes the stalk market a lot more profitable.
Turnip is a fascinating addition in Animal Crossing: New Horizons, and arguably what promotes the game’s social aspect from a cute distraction to an absolute necessity (that is, if you want to play optimally). It is the de facto stock market on the deserted island, where you strive to buy low and sell high in order to pocket a decent profit. Plus, did I mention that you can visit your friends’ island for some bonus trading opportunities?
In this post, I examine the “stalk” market through the mean-variance optimization lens. Is it worth it? When should you sell? To what extent can your friends be of assistance? As some might expect, the answers lie in the modern portfolio theory.
The Stalk Market Explained
Turnip, though appears to be a common commodity, has a few distinct traits to it -
- You can only buy it from Daisy Mae every Sunday
- Every morning and afternoon of the following Monday to Saturday, a new quote will become available at Nook’s Cranny
- The whole thing expires the next Sunday
However, turnip differs from most financial assets in at least one meaningful way. It is far from clear whether the underlying price follows some variation of geometric Brownian motion, which is bound to have unintended ramification if we decide to borrow from the asset pricing machinery. But it’s not totally hopeless, as will be shown shortly - we can pin it down numerically.
It’s also worth noting that in the absence of an optimal selling strategy (comment if you know better!), I am going to make an assumption that makes the problem far more tractable (and less path-dependent): let’s only sell our turnips at one specific time window (out of the total 12 of them), and such decision will be made solely based on Sharpe ratio.
Turnip’s Price Dynamics
For a long time, it has been known to the Animal Crossing community that the turnip price isn’t truly unpredictable. Instead, it follows one of the following four patterns:
- random
- decreasing
- large spike
- small spike
Now thanks to the extraordinary reverse-engineering work done by Treeki (see here), the mystery behind turnip price has been deciphered in its entirety, to the point where it becomes possible to simulate the prices numerically, enabling Monte-Carlo-style analysis:
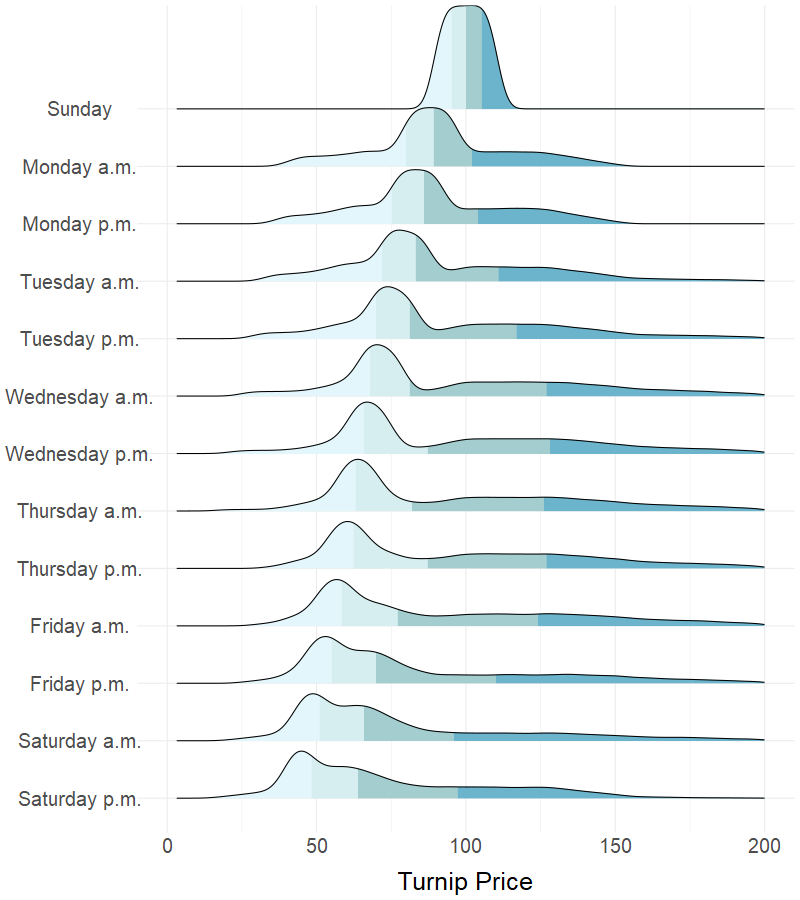
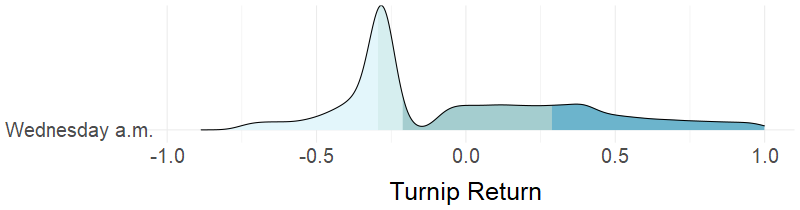
Strategy: Sell on Wed a.m. and Go Away
Juding from my experiment of 100K trials, if we have to limit our timing of selling turnips to one of the 12 available slots, Wednesday a.m. seems to be the best choice both in terms of expected return and Sharpe ratio. If we follow this strategy, a return of almost 10% can be expected over the 3-day time frame - significantly outperforming virtually every asset class in the real world, mind you. See appendix for details.
A Better Strategy: What If You Have Friends?
To make things more interesting, the game also allows you to buy (on Sunday) and sell your turnips (in the following week) on a friend’s island. Taking advantage of such flexibility, a rational turnip investor will compare as many options as possible and only buy at the minimum and sell at the maximum across all islands.
Analytically, let $P_1$, $P_2$, …, $P_N$ be the turnip prices observed on $N$ different islands. Assuming they are i.i.d. and follow the cumulative distribution function of:
\[F_P(x) = G(x)\]the maximum value $Q$ where $Q = max(P_1, P_2, …, P_N)$ will have the cumulative distribution function of:
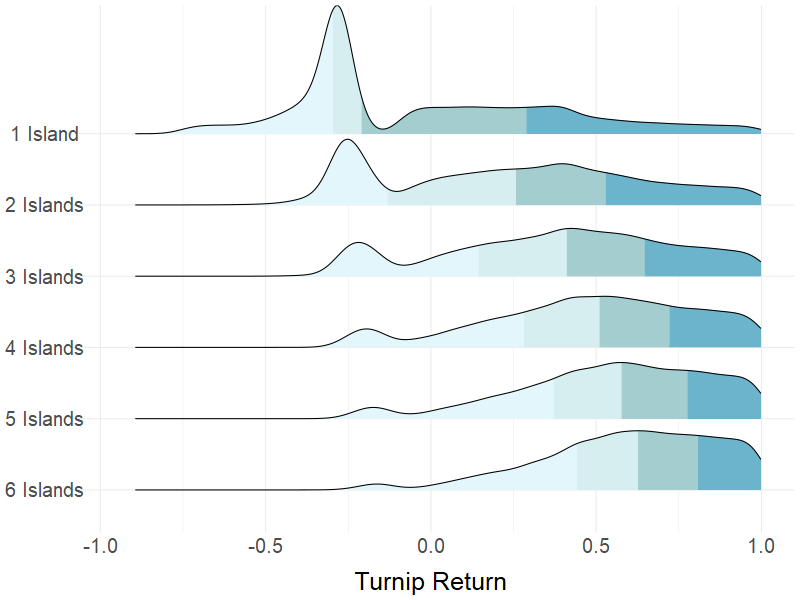
\[\begin{align} F_Q(x) &= \mathbb{P}(Q \leq x) \\ &= \mathbb{P}(max(P_1, P_2, ..., P_N) \leq x) \\ &= \mathbb{P}(P_1 \leq x \ ∩ \ P_2 \leq x \ ∩ \ ... \ ∩ \ P_N \leq x) \\ &= \mathbb{P}(P_1 \leq x) \mathbb{P}(P_2 \leq x) \ ... \ \mathbb{P}(P_N \leq x) \\ &= G^{N}(x) \\ \end{align}\]As a result, the new distribution undersamples the smaller values and oversamples the larger ones at the same time, effectively shifting the probability mass to the right. The more islands we have at our disposal, the more advantageous the situation becomes. A single additional island brings a staggering fivefold increase in expected return and almost fivefold increase in Sharpe ratio. Once it reaches 6 islands, you can expect a 122% return over the same 3-day time period with a Sharpe ratio of 0.98, dwarfing any hedge fund super star who has ever walked the earth by far.
For our final thought experiment, let’s push the number of islands to infinity. People have already been taking advantage of price discovery websites (such as Turnip Exchange) to expand their opportunity set. In the extreme case, the return distribution collapses to one single number as the turnip investor buys at the global minimum and sell at the global maximum (90 and 660 Bells respectively per my simulation) and is no longer a random event. In other words, a guaranteed 633% return for the ultimate turnip master.
\[\mathbb{ E } ( r_{ \infty } ) = r_{ \infty } = \frac{ 660 }{ 90 } - 1 = 6.3333\]Conclusions
Turnip is a great investment by all means. With a little planning, some hardwork and a few friends, it consistently delivers some of the best returns known to humankind. Some might argue that the game’s interface doesn’t really make it easy for players to abuse the system, but that’s another story for another day.
Meanwhile, to my fellow turnip traders, happy investing. Just be careful and don’t let the Nooks know.
Appendix
Table 1: Optimal Selling Window
| Time | Expected Return | Volatility | Sharpe Ratio |
|---|---|---|---|
| Monday a.m. | -0.0895 | 0.2211 | -0.4049 |
| Monday p.m. | -0.1115 | 0.2379 | -0.4687 |
| Tuesday a.m. | -0.085 | 0.3118 | -0.2725 |
| Tuesday p.m. | 0.0462 | 0.6951 | 0.0664 |
| Wednesday a.m. | 0.0953 | 0.7169 | 0.1329 |
| Wednesday p.m. | 0.092 | 0.7133 | 0.129 |
| Thursday a.m. | 0.0754 | 0.7238 | 0.1042 |
| Thursday p.m. | 0.0829 | 0.7229 | 0.1147 |
| Friday a.m. | 0.0437 | 0.7328 | 0.0596 |
| Friday p.m. | -0.0361 | 0.7379 | -0.049 |
| Saturday a.m. | -0.2054 | 0.3844 | -0.5343 |
| Saturday p.m. | -0.2562 | 0.3297 | -0.7771 |
Table 2: Selling on the Optimal Island
| Number of Islands | Expected Return | Volatility | Sharpe Ratio |
|---|---|---|---|
| 1 | 0.0953 | 0.7169 | 0.1329 |
| 2 | 0.4707 | 0.8983 | 0.524 |
| 3 | 0.7221 | 1.0167 | 0.7102 |
| 4 | 0.92 | 1.1097 | 0.829 |
| 5 | 1.0824 | 1.1853 | 0.9132 |
| 6 | 1.2234 | 1.2495 | 0.979 |
| … | … | … | … |
| ∞ | 6.3333 | 0 | ∞ |
Update May 4, 2020: Previously-inaccurate statement regarding randomness of turnip price has been corrected. Thanks to Chau-Wai Wong.
Update May 6, 2020: Included discussion on the cases where people use price discovery app to pinpoint the best price available and what if somebody has infinite number of friends. Thanks to Freya Yi.
This is Part II of my Animal Crossing post series. For Part I, see here; for Part III, see here.